A question of nite vision
Can electronic eyes express aptly a starry night?
An average human eye has three regimes of light perception. A photopic vision under well lighting conditions, also known as daylight vision; a scotopic vision under bad lighting conditions, also known as nightlight (nite) vision; and, the transitions domain, known as mesopic vision. The photopic vision is due cone cells and gives a perception of colours. The scotopic vision is due rod cells and the perception is monochromatic. In the intermediate region, both kinds of the visions are activated: bright stars or far cities lights are colourful, while a surrounding countryside, drowning in the darkness, is imagined by degrees of grey.
Modern photographic cameras, on the contrary, are extremely sensitive to light, serving all pictures in full colours regardless on its intensity; night time pictures reveals nuances never seen by humans before.
I have found the discrepancy very interesting on the first sight. Unfortunately, I have been unable to find any relevant formal (mathematical) description of mesopic vision, in available literature ([1]). That was the impulse to develop a method for truthful reproduction of the human nite vision on digital pictures. The method, based on a simple unconfirmed hypothesis, is presented by this article.
Compound intensity
Visual perception in mescopic, the intermediate, domain, is perhaps result of synthesis of light excitements of cones and rods by our brain.
The model design assumes that a photon has been detected by the cone, and accepted by brain, with certain probability w. By the way the probability, that the photon will be signalised by the rod, the second receptor, is 1 − w. A formal description takes the form
photons seen = w (photons by cones) + (1 − w) (photons by rods).
Photopic regime has w close to unity like a digital photograph.
Electronic eyes sees colour in full intensity range, while human eyes bright sources only. An image of faint sources can be recovered by transferring photons gathered by electronic eyes into scotopic vision.
Photons seen by rods (scotopic photons) can be reconstructed from the fully coloured images. Cone cells provides information about the intensity and the colour together. The sensitivity is described by X, Y, Z tristimulus values in CIE 1931 XYZ colour space. The basic colours X, Y, Z reflects the sensitivity of photopic vision of eye. Y component represents intensity; the value is proportional to amount of photopic photons. X, Z stimulus brings the colour information.
The idea for the reconstruction is on base of the vector representation of colours: every colour shade is a point in the CIE 1931 XYZ colour space. Elements of Hilbert space (a generalisation of vector spaces) can be mutually transformed via projections and inner (scalar) product of functions.
I derived a formula for projection of XYZ tristimulus sensitivities to the scotopic sensitivity:
The blend of scotopic and photopic intensities (luminances), naturally including mesopic, can be, by the hypothesis, proclaimed as
We should keep in mind S(X, Y, Z). This model has no any experimental verification.
The detection of light by our eyes is proportional to incoming light intensity, or, precisely, to amount of photons which activates the light detection cells. The proportionality is limited in intensity, cells becomes saturated by light. If the saturation level is reached, the cells are out of order.
The saturated rod cells (night vision) are ignored by brain during daylight, and becomes important in night when cone cells are unable to see anything, and their zero signal is ignored as well as.
The function which describes growing of populations is logistics function. The “population” increases by capturing of incoming photons, and decreases by “pumping” up of electric impulses by our brains.
The arguments gives to birth of a hypothesis, the weighting function w(Y) is logistic function
Parameters are the mesopic level Ym, the intensity Y in which photopic vision has the same weight as scotopic one, and the mesopic width wm, the width of the transition domain. This weight function can depends on Y, S, or be a function of both, or be more complex.
The intensities Y, S are related to give a normalised luminance. The relation comes from the spectral efficiency of both cells as well as from density on retina. The article say that scotopic vision has 2.5⨉ efficiency which is, perhaps, comparable to a signal due all three cone cells (the factor 2.5 is for the green cone only). That is the reason why I normalise both photopic and scotopic intensities.
This mental picture is on base of an abstract model. I believes there is a description, maybe biological, having origin in basic principles of Nature.
Colour blend
The description of blending of colours is on the same base, if we will work in an orthogonal colour space, where changes in the intensity does not change colours and vice versa. In this important case, the colours, the colour shade, stay constant when the luminance is varying.
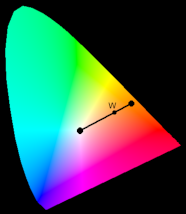
Blending of colours orange and grey into “faded orange” in xyY space
Lets have two colour points with coordinates given by the colour channels, and the scotopic point on coordinate of a white point in given colour space. If we are assuming that the weighting function can be shared, than mesopic colour is
colour seen = w (colour by cones) + (1 − w) (grey by rods).
There is known rule how to blend colours in CIE 1931 XYZ colour space (see Mixing colors specified with the CIE xy chromaticity diagram). [2] The colour blend of photopic and scotopic channels can be described in term of the colour coordinates xyY. It leads to formulas:
where the weighting denominator is
The question is a choice of xs, ys which represents chromatic coordinates of scotopic vision. I suppose we are perceive dark as black, and other dim colours as degrees of grey, so the coordinates should be identified with the appropriate white point of given colour-space (xs = 0.3127, ys = 0.3290 for CIE 1931 XYZ and D65 illuminant). The use of different chromaticity coordinates gives the same information (it can be checked on missing red parts of original images), but in some strange colour.
An average colour of Y stimulus is green; the colour of scotopic stimulus is something like green-blue (azure?) colour. The human perception of darkness colours by rods are shades of grey, not shades of azure, therefore the scotopic vision is modelled by grey, notwithstanding it is azure. (It maybe relic of evolution, or a way how to indicate the current vision domain).
Again, the colour mixing is the hypothesis. It can be verified for photopic domain, the blending of scotopic colours may follow a different law.
Glow of zodiac
A picture is worth of thousand words. To demonstrate the method, I selected an image of zodiacal light taken by me on 23. March 2011 by Canon EOS 60D. The twenty second long exposure by fish-eye shows the evening atmosphere, highlands, a far red light of a transmitter, clouds near to horizon reflecting city lights, high clouds with air crafts, and the sky with Taurus (Pleiades, Hyades), Perseus (M34, χ+h), Cassiopeia (M52) and Andromeda (the galaxy) constellations and finally the cone of zodiacal light at the image centre.
I prepared tree samples of the same frame as demonstration of photopic, mesopic and scotopic visions. The differences are mostly striking on red parts as the transmitter, or the near horizon clouds.
The first sample is fully coloured image. The strange blue background is given by white-calibration of the camera, or by a real colour of the twilight sky due light scattering. No photometry corrections (bias+dark or flat-field) has been applied.

Zodiac as seen in full camera colours, in photopic domain
The intermediate frame has no such bewitching colours as the fully colour sample. I believes it is more close to realistic reproduction of the evening atmosphere. The colour of zodiacal light itself appears with blue glow. It may by a real effect, but more likely it is an artefact due local maximum of intensity.
The picture is reconstructed by my memories; it is not something on we can rely on. More exact method of determination of levels should by considered.

Zodiac scene as seen by my eyes in mesopic domain
The last picture is unrealistic demonstration of scotopic vision. Zodiac is slightly more apparent, the scotopic vision is slightly more efficient for blue. All red lights vanished completely as one can expect for the spectral sensitivity of scotopic vision. [3]

Zodiac scene in nite vision, scotopic
Dumbbell nebula
The most prominent demonstration of photopic and scotopic vision offers Dumbbell nebula. The remnant of explosion of a star in form of bright famous planetary nebula.
Its expanding envelope has nice green parts. The colour is very uncommon, at least on everyday experience, because the light is emitted in extremely hot, but very sparse, region, where mutual particle collisions are extremely rare. The environment permits to live emitted atoms for a long time on low probability energy level which is, due historical reasons, called forbidden (the light is due forbidden spectral lines).
As the envelope expands, it interact with ambient medium and push surrounding material which gives origin of a shock waves, which can be observed as a deep red colour on the edges of the nebula. The colour is given by a material on very high temperature which dominantly emits in Hɑ line.
The remnant of the original star is the blue object at nebula centre, which is a white dwarf.
The colour imaging of Dumbbell nebula is gives us a complex picture of the interesting object, but Mrgs. Ch. Messier, the discoverer, saw perhaps something different.

Full colour image of Dumbbell nebula. Images has been taken at MonteBoo Observatory by 0.6 m Newtonian telescope with (near) Johnson BVR filters. Credits to J.Połedniková, O. Urban and M. Kocka.
The scotopic modelling of the nebula image gives picture which is more similar to past drawings appearance, maybe the name of Christmas double-bell as I see in that rather then a dumb-bell. Take a look in the telescope, make a sketch, and compare you vision with the simulated picture.

Dumbbell nebula in nite vision. The double-bell structure is evident.
Open questions
All the above ideas, writings, contains speculations and weak-anchored models. Moreover, I have additional open questions.
Does depends the mesopic width on adaptation? I have certain suspicion that the mesopic width can depend on current adaptation. It is impression of manual processing of many pictures; unfortunately, it is difficult to recognise varying levels of background. A reliable photometry calibration can be very helpful. The light adaptation mechanism is unknown for me.
Are relative light fluxes of photopic and scotopic perceptions equal? The mixing formula brings a weighting factor w, but I’m, in silence, assuming that efficiency of Y and S is the same. Is it true? Is the sensitivity balanced by the way that fluxes are the same? I suppose no, but I have no another information for a deeper analysis.
The sensitivity is given by perception, as our brain evaluates electric signals by eye; but it can depends on amount of taken photons and on their energies. It also depends on density of detectors (rods) on retina. I have no idea what happens when two photons with energy 3 (shot-wavelength) and 2.5 eV (maximum scotopic) are detected as the single impulse or with 1.2⨉ stronger signal? Shortly, has the scotopic vision better efficiency or not?
Is it possible to reconstruct human vision by a photometricaly calibrated picture? In principle, yes. The scotopic range is approximately from mili- to five candelas per square meter (no reliable reference), so a photometry calibration of pictures can clarify that.
Can be scotopic colour mixed width colour by a standard mixing formula? I do not known. It is a blind shot.
Is the scotopic vision really in degrees of grey? By my personal experience, yes. It is question for wider sample of observers, specially heavy drinkers or drugs users.
Is the logistics function properly describing the intermediate connection? It is pure speculation.
Conclusion and summary
A proper blend of photopic, mesopic and scotopic visions on a single colour image is the open question. I proposed a hypothesis, and presents a model for realistic express of night scenes as a contradiction to fully coloured images by modern digital cameras on base of colours tuning in orthogonal colour spaces.
The algorithm summarises application of the blend of scotopic and photopic visions:
- Acquire image and convert it CIE 1931 XYZ and yxY colour spaces.
- compute w(Y), S(X, Y, Z)
- compute Yn, xn, yn
- convert it back to CIE 1931 XYZ
The final Xn, Yn, Zn colours should by converted to a colour-space of a displaying device (commonly sRGB or AdobeRGB).
I think the digital cameras can be a very cheap and efficient tool for understanding of human perception of light. From my perspective, a reliable and easy calibration procedure can be very useful.
The subject needs further investigation.
Notes
The obsolete implementation of night vision on both Munipack and Fitspng was:
which also blends colours, but by an improper way. This novel approach handles blending in more exact manner.
The obsolete weighting function was cumulative Normal distribution: {1 − erf[(Y − Ym) ⁄ wm√(2)} ⁄ 2. The logistic function has better theoretical justification. In practice, the functions are nearly equal, even tanh(x) can be computed significantly faster (needs only one evaluation of exponential function exp(x)).
Footnotes
| [1] | The kind of mixing procedure is implemented by CIECAM02 colour space; it is a different kind of mixing, because scotopic vision is not in mind. |
| [2] | The blending can be computed also in CIELUV, or CIELAB colour-spaces. In the spacess, the blending means change of colour saturation, or decreasing of radius of chroma. Results are equivalent, but the conversion is computationally less efficient. |
| [3] | The approach can be used to suppress of a (colour) noisy background, the common sign of urban exposures. The orange-toned heavens due sodium lamps can be transformed to more realistic orange shade. |